3.4. Extended Convergence Checks
We repeated many MD simulations with increasing simulation times to ensure convergence. Viewing multiple simulations in the same dihedral PCA space of a reference simulation allowed to compare sampling of different simulations. Observing structures that are present in one but not in another identical repeat simulation implies the simulations are not converged. Fig. 3.13 shows different GaMD simulations of compound 22 with different total simulation times. Increasing the simulation time from 1000 ns to 2000 ns only changed the PES landscape minimally, whereas shorter simulations, such as 100 ns, did not converge and cover only a fraction of the PES surface of the longer simulations.

Fig. 3.13 dPCA PES of 2k, 1k, 100 ns GaMD simulations in \(\rm H_{2}O\). The middle and right plots are within the PCA space of the left plot.
The GaMD simulations for compound 22 converged at 1000 ns simulation time. To ensure convergence, we ran most simulations for 2000 ns. This is strictly valid only for the \(\rm H_{2}O\) solvent. Other solvents might take different simulation times to converge.
As an additional convergence check, we performed 2000 ns GaMD simulations with different starting structures. We used the clusters identified in Fig. 3.9 as starting structures. Fig. 3.14 shows comparable dPCA-PES for all replica runs, therefore we consider the simulations converged.
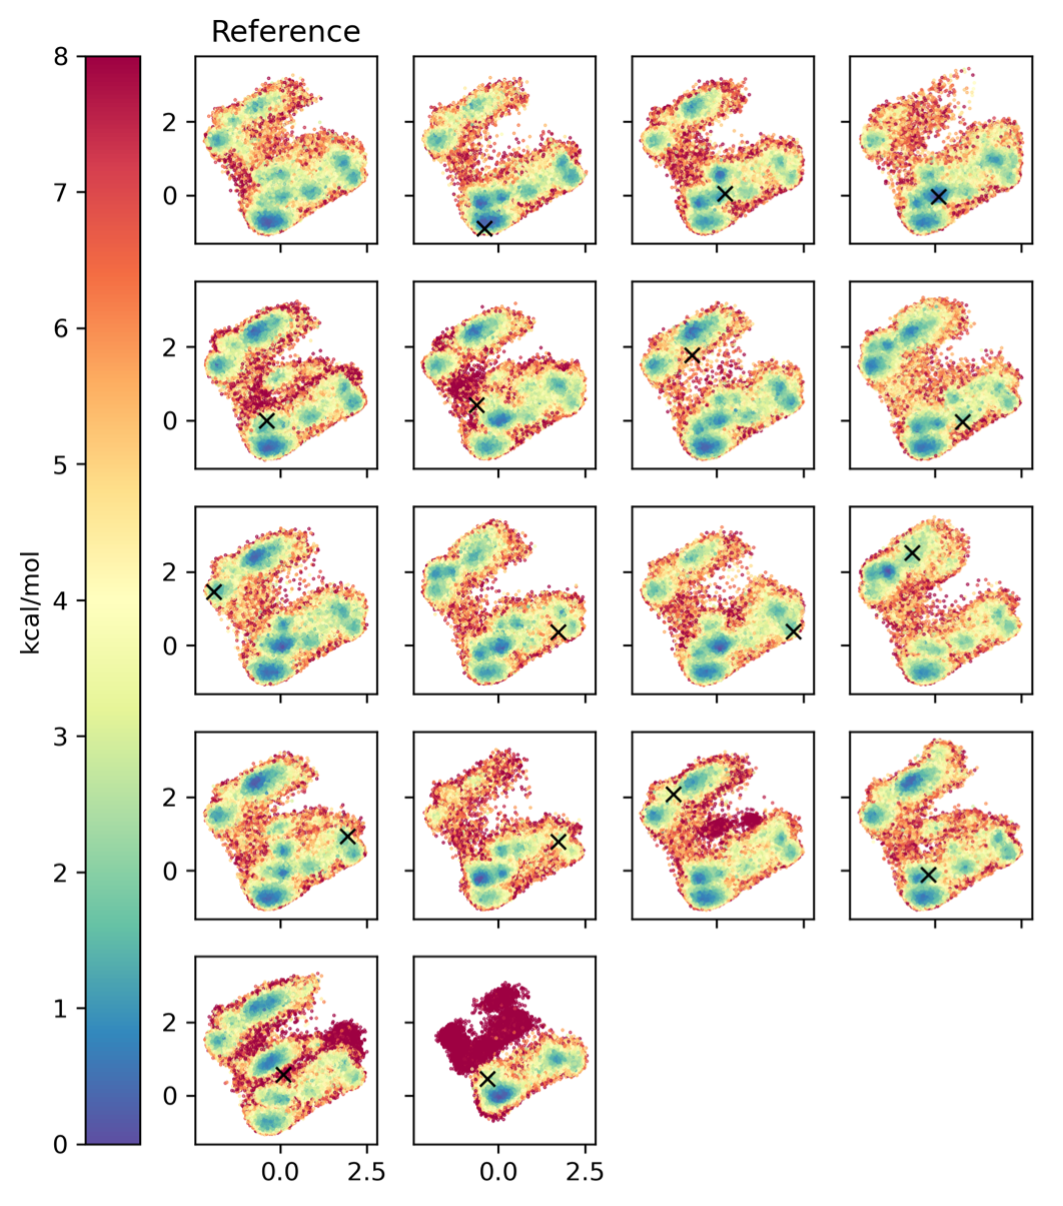
Fig. 3.14 Extended convergence check, showing the reference simulation (top left), and replica simulations starting at every cluster that was identified in the reference simulation. The respective starting structures of the replica (clusters in the reference) are denoted with a black x. All replica simulations are in the same dihedral PCA space as the reference simulation for comparison. The axes show the first and second principal components.